
http://www.dyestatcal.com/ATHLETICS/XC/2010/rankings.htm
Who is missing? Who should move up? Who are the top individuals?
Wednesday, September 15, 2010
CCS Top 15 rankings courtesy of www.lynbrooksports.com
Tuesday, September 14, 2010
Mt. Pleasant not fielding XC team this fall...
From the BVAL commissioner:
"Coaches, we just received notification that Mt. Pleasant will not be fielding a team this cross country season."
Monday, September 13, 2010
Earlybird Post-Meet story and records by Gus Ibarra...
Earlybird Post-Meet Write-Up
Crystal clear skies and moderate temperatures welcomed
everyone to kick off the 2010 cross country season on the beautiful California
coast at the 2010 Earlybird Invitational
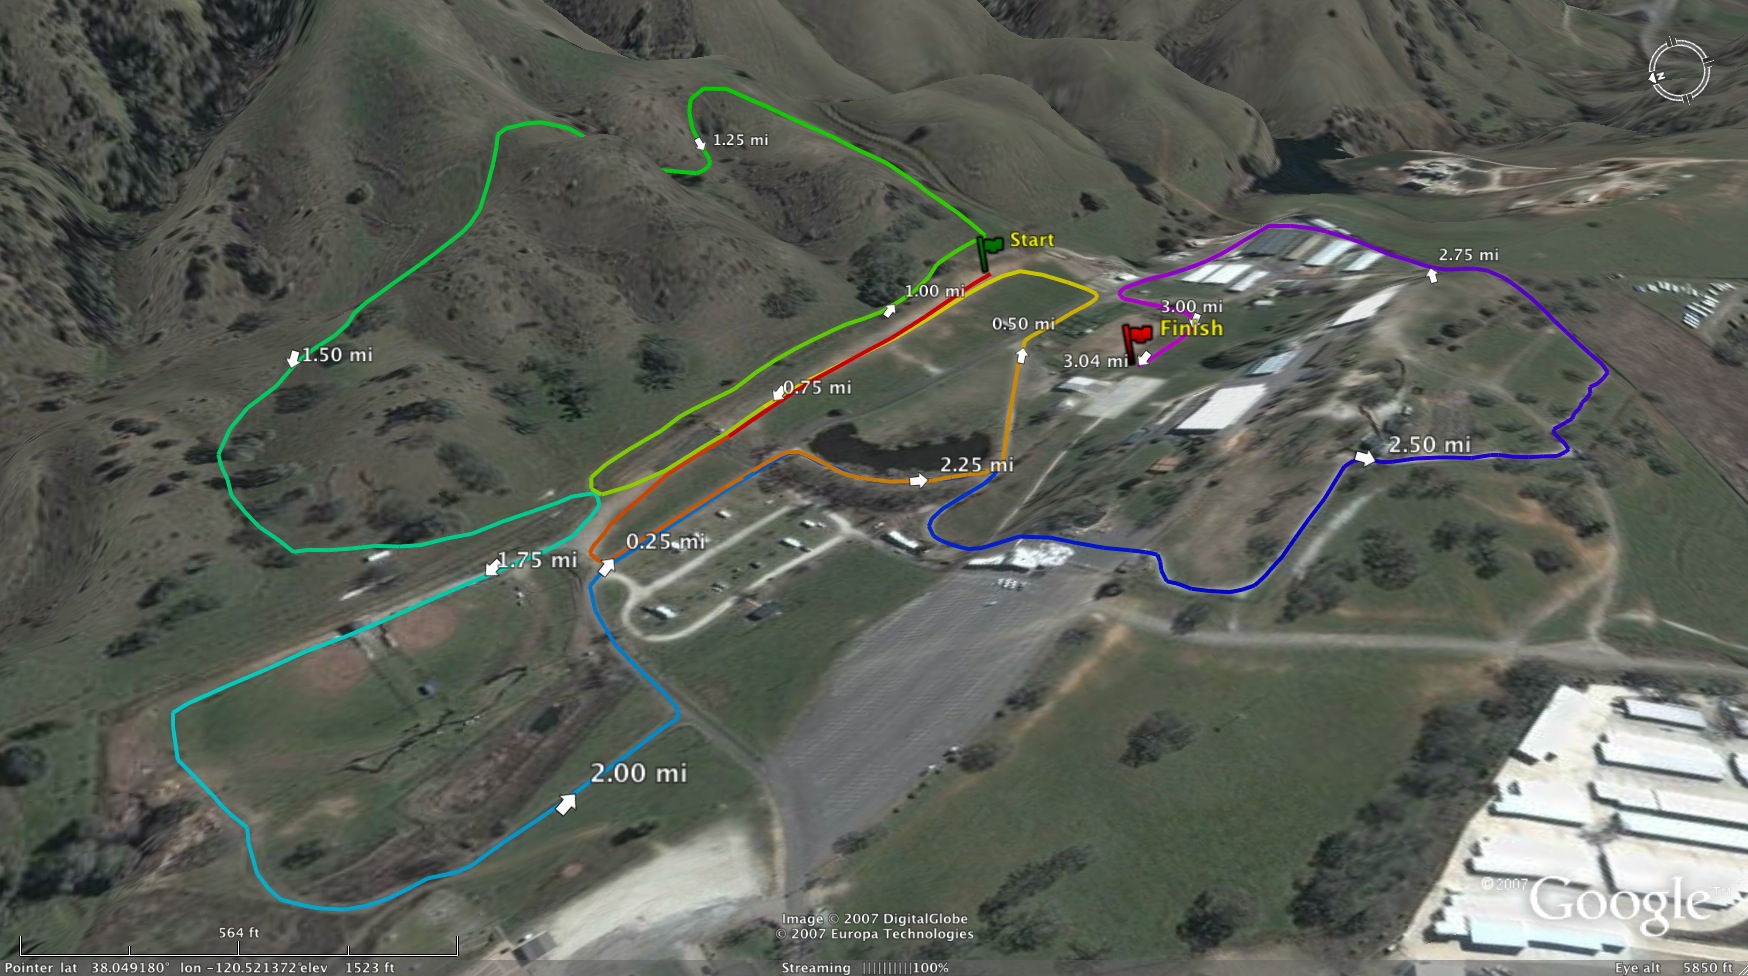
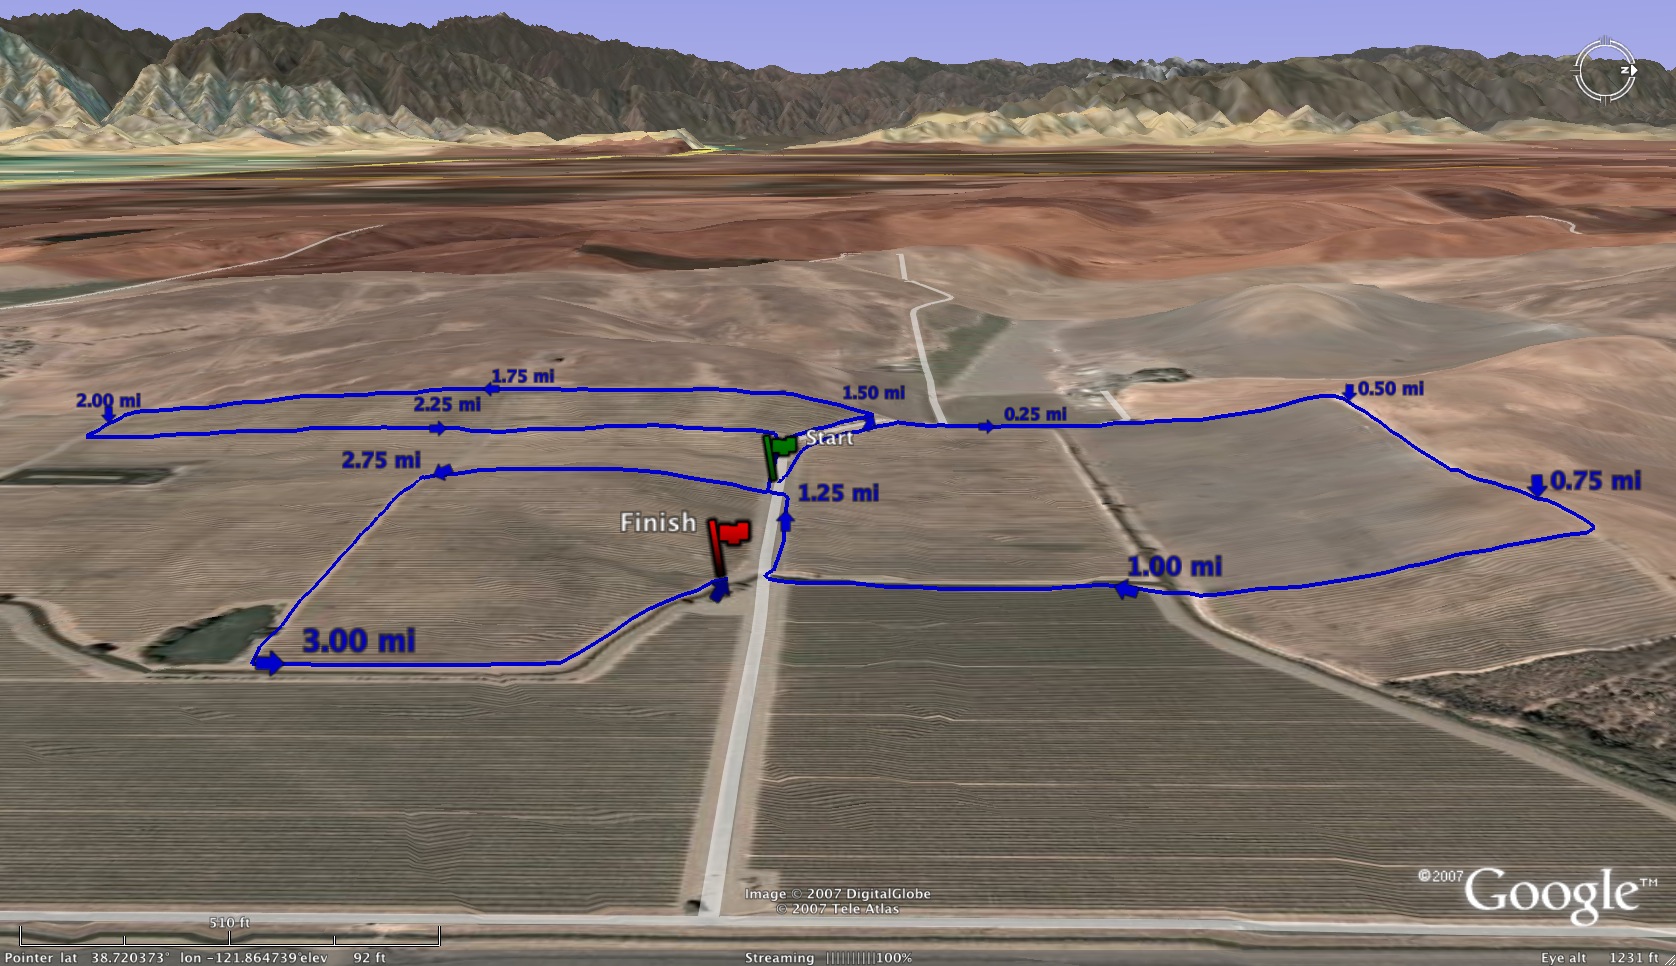
at Toro Park (Salians) hosted by North Monterey County High School. High
temperatures had plagued the event in recent years but this edition was about
as good as it gets. The meet drew one of its largest crowds ever with the CCS
Finals to be held here later in the year and lots of pre-season questions were answered.
The unmatched early season competition plus the great conditions made for some
amazing results!
The day kicked off with our open race for the truly brave
coaches, parents, alumni, etc. and the host school was proud as former runner Danny Tapia (NMC class of 2004) toured
the 3 mile layout in what we believe to be the fastest ever clocking on the
course at 15:02! Danny recently became the first local runner to ever win the
Big Sur Marathon and is shooting for a run at the 2012 Olympic Marathon Trials.
Next we had the first ever middle school race as part of the
festivities and the eager young harriers toured an altered 2 mile layout
without the famous Toro hills. Official results were not kept in this inaugural
edition but we can say there were nearly 100 kids and we hope to expand this
portion of the event for 2011!
Then, the real show began! The ladies were highlighted on
the individual front while the gentlemen had the fastest early season crew in
the history of the course! Rachel Hinds
(St. Ignatius) has been the Earlybird darling the last 3 years with amazing
wins each year to kick off the season. She burst onto the running scene here
four years back and today she sealed the deal with what may have been the best
dual in the history of the meet. Jessie
Peterson (Carlmont) had played second fiddle to Rachel in two previous
editions and today she wanted to play spoiler. The two dueled throughout the
race with Jessie pushing the pace early on and looking to break Rachel before
the Toro hills. Rachel rallied as they hit the hill loop and came out onto the
final flat loop with a slight lead but looked to be struggling. Jessie made a
big move to bring her back in the last half mile and Rachel got her second
breath and put in an amazing last quarter mile for the win and an Earlybird
four year sweep!! She stopped the clock at 17:59.5 that was later made official
at 18:00 and launched her to #3 ALL-TIME at the park!! Her
performance may rank as one of the greatest early season efforts we’ve seen in
this area of California. She now only trails the legendary mark by Tori Tyler
of 17:16 (Gunn 2004) and the great run by Michelle Gallagher at 17:53 (Sacred
Heart 2002). Jessie finished strong only 9 seconds back at 18:09 and rockets to #7
ALL-TIME! Unfortunately, Rachel and Jessie will represent CCS in different
divisions down the road but these performances place them right among the state
championship favorites! A great footnote is that Rachel will take her amazing
talents to Stanford, but, the running community will loose a great one and take
a step back as she goes on to play Lacrosse! We wish her and Jessie the best!!
The boys show was highlighted by the Bells from Bellarmine! We knew they would be
special in 2010 and we were not disappointed. They put on a team running clinic
with a combined team time of 81:10
which moves them to a tie with North Monterey County (2003) to 4th All-TIME at the park!
They now only trail Mountain View (80:13 2008), Los Gatos (80:45 2006), and
Carlmont (80:49 2006) on the record board! And, the teams ahead of them set
those marks late in the year. Bellarmine has the tools to take the 80:13 record
down at CCS Finals and could make some noise at the state level in the
ultra-tough Division I level. Today they featured a 23 second 1-5 spread and
dominated the field so much that they would have placed 6 runners before any
other team had their 2nd runner in!!! Incredible team running with a
HUGE upside for this squad. San Benito
(83:21) and Madera South (83:34)
placed 2nd and 3rd overall and renewed their friendly
rivalry once again after also locking horns last week. Los
Altos and Willow Glen also
showed well while a couple of our pre-meet favorites struggled here but we’re
hoping that when things really count they will be back in the mix.
On the team front for the ladies we had Jessie Peterson lead
Carlmont to a nice early season
effort at 99:48. They featured three girls under 20:00 and if they can shore up
their final two scorers they could be a force down the road. Mountain View may have had the best
team showing top to bottom as they ran 100:41 but featured five girls under
21:00 and has the depth to mix it up in big fields later on. Los Gatos, St. Ignatius (led by Rachel Hinds) and a re-surging San Lorenzo Valley squad, rounded out
the top five teams today.
On the grade level team front we had Bellarmine once again being the class of the field winning ALL FOUR
BOYS RACES and with that, taking home the OVERALL
TEAM CHAMPION AWARD even though they don’t even have girls! San Lorenzo Valley had the best new
crop winning the 9th grade girls race while Presentation (10th grade), Mountain View (11th grade), and St. Ignatius (12th grade) also took home team plaques.
On the individual grade level front we had our trophy
winners in Anna Maxwell (9th
19:10 San Lorenzo Valley), Danielle Katz (10th 19:02 Los Gatos),
Morgan Lira (11th 18:51 Valley Christian), and Rachel Hinds (12th 18:00 St.
Ignatius) for the girls and Takuto
Doshiro (9th 17:02 Monta Vista), Richard Ho (10th 16:00
Leland), Kevin Bishop (11th 15:51 Monta Vista), and Domenic D’Aquisto (12th 15:42
Enterprise) for the boys. We want to congratulate Domenic for his 3rd
Earlybird win in 4 years!!
Well folks, thank you to everyone that helped make the meet
possible and we especially want to congratulate all the runners as they are the
ones that it’s all about. We wish you all the very best in 2010 and we hope to
see you back at Toro Park next year!
Coach Gustavo Ibarra
Earlybird Meet Director
Meet Website http://nmcxc.tripod.com/id22.html
(Updated park records
below)
Toro Park, Salinas
Course Records
Top Boys’ Teams
1 Mountain View 80:13 2008
2 Los Gatos 80:45 2006
3 Carlmont 80:49 2006
4 North Monterey County 81:10 2003
4 Bellarmine 81:10 2010
6 Willow Glen 81:23 2006
7 Carmel 81:39 2003
8 San Benito 81:41 1998
9 St. Ignatius 81:48 2006
10 Aptos 81:52 2008
Top Girls’ Teams
1 Los Gatos 96:01 2006
2 Mountain View 96:11 2008
3 Carlmont 96:22 2006
4 Aptos 96:57 2005
5 Gunn 96:59 2002
6 San Lorenzo Valley 97:17 2004
7 Monta Vista 97:34 2005
8 Mitty 97:51 2004
9 Half Moon Bay 98:20 2004
10 Carmel 98:30 2006
Top 25 Boys All Time
-
1 15:12 Petrillo, Matthew 12 Los Gatos 2006
2 15:13 Abdalla, Mohamed 12 Willow Glen 2007
3 15:18 D’Acquisto Domenic 11 Enterprise 2009
4 15:20 Estrada, Diego 12 Alisal 2007
5 15:21 Mineau, Jeremy 11 Menlo Atherton 2002
6 15:22 Fitzpatrick, Dylan 12 Carmel 2004
7 15:24 Dunn, Alex 11 S an Lorenzo Valley 2002
7 15:24 Morales, Ben 11 San Benito 1998
9 15:27 Johnson,Tyre 11 Palma 2007
9 15:27 Lema, Nohe 12 Willow Glen 2008
11 15:28 Hunt,Rylan 12 Aptos 2008
12 15:29 Rowe, Garrett 10 Mountain View 2008
12 15:29 Schuh, Parker 11 Mountain View 2009
14 15:31 Sitler, Ben 11 St. Francis 2004
15 15:33 Strum, Weston 12 Pioneer 2009
1615:34 Huerta, Nathan 11 North Monterey County 2003
16 15:34 Nelson, Tim 10 Liberty Christian 2000
16 15:34 Sartor, Matt 12 Enterprise 2000
19 15:35 Corona, Marcos 12 Willow Glen 2006
19 15:35 Knorr, Robbie 12 Valley Christian 2006
21 15:37 Myjer, Ian 11 Mountain View 2008
21 15:37 Signore, Luca 12 Lynbrook 2009
23 15:38 Lynch, Brennan 12 Santa Cruz 2008
24 15:40 Parsel, Patrick 12 Carmel 2003
25 15:42 Schneider, Kevin 11 Fremont 2004
Top 25 Girls All Time
-
1 17:16 Tyler,Tori 12 Gunn 2004
2 17:53 Gallagher, Michelle 12 Sacred Heart 2002
3 18:00 Hinds, Rachel 12 St. Ignatius 2010
4 18:02 Nevitt, Casey 12 Aptos 2002
5 18:07 Barnett, Stephanie 11 Leland 2007
6 18:08 Grelli, Melissa 11 Presentation 2002
7 18:09 Plank,Mckayla 10 Mitty 2002
7 18:09 Viehweg, Ciera 10 St. Ignatius 2002
7 18:09 Peterson, Jessie 12 Carlmont 2010
10 18:15 Fedronic, Justine 12Carlmont2008
10 18:15 Bergman, Jennifer 12 Valley Christian 2008
12 18:16 Kirschman, Lindsey 11 Enterprise 2004
13 18:17 Graham, Ruth 12 Gunn 2002
14 18:20 Follmar, Alicia 12 Saratoga 2004
15 18:21 Johnson, Taylor 11 San Lorenzo Valley 2006
16 18:23 Daly, Katy 10 St. Ignatius 2006
17 18:25 Hamilton, Samantha 9 Half Moon Bay 2006
18 18:28 Van Ausdall, Jessica 12 Aptos 2005
19 18:30 Jones,Cobbie 11 Live Oak 2004
20 18:31 Goodwin, Jill 12 Los Gatos 2006
20 18:31 Curtis, Chloe 11 Redondo Union 2008
22 18:32 Boyd, Amanda 12 San Benito 2005
23 18:33 Reynolds, Maryann 10 Mountain View 2006
24 18:34 Lee, Thea 12 Carmel 2006
24 18:34 Schnittger, Amy 11 Aptos 2006
Visit the meet website for complete coverage!
http://nmcxc.tripod.com
================
Just added from SJ Mercury News
Katz, Geiken run well for Cats at Early Bird
http://www.mercurynews.com/los-gatos/ci_16067391?nclick_check=1
Caveats with ratios by Sstoz Tes
Here is a following up by Mr. Tes in regards to an earlier post to address some of the questions that came up when you compare different cross country courses.
==========================================
By taking overall averages, I papered-over all sorts of important
sub-populations whose ratios are substantially different from the
overall picture. The basic assumption for producers and consumers alike
is that the sub-populations all have a close-enough ratio to the overall
population to make it all come out in the wash. Depending one one’s
attachment to accuracy and precision, this may or may not be the case.
The primary problem with calculating for sub-populations is that,
despite a population of over 9 000 data points, sub-categorizations can
easily become too small to be reliable. With that in mind, I have delved
into the results to see what makes it through that wash.
Because of interest in the S.S. state-meet qualifier and because it has
by far the largest population (2 529, compared to the 2nd largest at 1
350), I began to first reduce those results in search of more refined
ratios. I came up with some surprising results. Note that I have not
taken the time to do null hypothesis testing for the below. It has been
too long and I’d have to refresh my memory. If anyone is interested
enough to have me do formal testing, I’ll be happy to do it.
The first delving into sub-populations is the most obvious: separating
the ratios of boys and girls to the state-meet course.
boys: girls:
mu: 1.01863 1.00837
sigma: 0.02307 0.02485
The boys’s ratio is over 2,2 times greater than that of the girls. A
coach looking to predict his/her boys and/or girls team(s)
performance(s) would be led astray by using the overall ratio of
1,01377:1. S/he would predict times too fast for his/her boys and too
slow for his/her girls. Despite the relatively large difference in the
ratios, the error would amount to all of 4-seconds for the typical boy
and 6-seconds for the typical girl. Such are the margins between
disappointment and elation, particularly in the hyper-competitive team
battles. It is also interesting that the sigma shoots up, making the
confidence intervals even less useful.
Another obvious sub-population is class. Note that this is a sub-group
of a sub-group. The smallest sub-grouping (9th grade boys) has a
population of 69.
boys girls
9: 1.01931 1.01127
10: 1.01819 1.00814
11: 1.01786 1.00795
12: 1.01935 1.00748
Given the nerves associated with the state-meet, I am surprised that,
with the exception of the 9th grade girls, there is no apparent trend
here. Though it is conventional wisdom that experience helps with
state-meet performance, perhaps this is not a major factor, or if it is
perhaps the trend is hidden by the relative state-meet experience of the
different classes. Though it is marginally relevant, I have put in the
below tables to show the breakdown of first time state-meet particpants
in any given race at the state-meet:
boys girls
1st state-meet 10th graders: 23,2% 27,3%
1st state-meet 11th graders: 30,1% 22,7%
1st state-meet 12th graders: 32,6% 18,5%
1st state-meet: 56,7% 54,8%
2nd state-meet: 24,9% 22,6%
3rd state-meet: 10,5% 12,0%
4th state-meet: 03,1% 06,0%
unknown: 04,8% 04,7%
Age or relative mental maturity might be other factors associated with
class and performance, but there are few things in the world less
mentally mature than a 9th grade boy, and they seem to perform at par
with the other grades. Perhaps the 9th graders who make it to the
state-meet are a special breed.
Parsing out the ratios of first time state-meet participants might yield
a worthwhile variable, but for now that is a bridge too far (for me) =)
A sub-group that M’r Beal wondered about was “packs,” particularly in
girls’s races. His qualitative observation is that those in the back of
the pack have a relatively difficult time at M’t SAC, and so their ratio
to the state-meet would be lower (indicating a relatively slow time at
the state-meet qualifier). Perhaps other state-meet qualifiers with
courses less difficult than M’t SAC would not show this difference.
z-score (range) boys girls
-1.6 -1.69 1.02994 1.02158
-1.5 -1.59 1.02582 1.02024
-1.4 -1.49 1.02648 1.02264
-1.3 -1.39 1.02628 1.02092
-1.2 -1.29 1.02480 1.02105
-1.1 -1.19 1.02125 1.02137
-1,0 -1.09 1.03167 1.01484
-0.9 -0.99 1.02628 1.01877
-0.8 -0.89 1.02734 1.01399
-0.7 -0.79 1.02697 1.01426
-0.6 -0.69 1.02302 1.01082
-0.5 -0.59 1.02587 1.01577
-0.4 -0.49 1.02393 1.01284
-0.3 -0.39 1.02068 1.01066
-0.2 -0.29 1.02115 1.00870
-0.1 -0.19 1.02028 1.01058
0,0 -0.09 1.01685 1.01282
0,0 0.09 1.01853 1.00716
0.1 0.19 1.01705 1.00423
0.2 0.29 1.01579 1.00938
0.3 0.39 1.01438 1.00464
0.4 0.49 1.01720 1.01355
0.5 0.59 1.01199 0.99675
0.6 0.69 1.01215 1.00136
0.7 0.79 1.01280 0.99927
0.8 0.89 1.01136 1.00085
0.9 0.99 1.01655 0.99942
1,0 1.09 1.01399 0.98704
1.1 1.19 1.01192 1.00213
1.2 1.29 1.01453 0.98729
1.3 1.39 1.02321 0.99459
1.4 1.49 1.00753 1.00358
1.5 1.59 1.00434 1.00899
1.6 1.69 1.00813 1.00359
1.7 1.79 0.99861 1.00034
1.8 1.89 1.00730 1.00897
1.9 1.99 0.99676 0.99489
2,0 2.09 0.99190 0.98883
I tested the packs by segregating the population into boys and girls,
then ordering the results by time at the state-meet qualifier. I then
calculated a z-score for each runner’s state-meet qualifier time (a
z-score simply places a single data-point in its proper place on a
distribution; nearly all data fits between -1,96 and +1,96). I bundled
runners into z-score intervals of 0,1, only graphing those groups with
>/= 10 athletes. Using the z-score as a basis for segregation has the
advantage of putting like-quality runners into the same group in a more
systematic fashion then percentiles. Rather than a grouping being
exclusively based on numerical order (i.e. the 90th percentile being the
fastest 127 runners, even if there is a substantial drop-off in quality
at, say, the 120th place), the z-score is exclusively based off of the
quality of a performance (i.e. the grouping between 1,00 - 1,09 standard
deviations).
For the girls, there is a steady trend down in the ratio all the way
from the fastest (at z = -1,69) to z = +1,3 group, which in this
distribution encompasses over 91% of the total population of girls. This
is to say that the state-meet qualifier is relatively slower (or the
state-meet relatively fast) the slower runner you are, as M’r Beal
suggested. A more detailed look shows that the fastest girls’s ratios
are on par with the overall boys’s--a bit over 1,02:1. By z =0,0, the
ratio drops below 1,02:1, then steadily erodes to less than 0,99:1
through z = +1,29. From z = +1,3 - +1,69 (n = 45), though, the trend
steadily reverses, averaging 1,0074:1 (this is still below the overall
girls’s average of 1,00837:1). From z = +1,7 through the end of the
distribution (n = 66, and which extends all the way out to +5,86!), the
downward trend re-asserts itself, averaging 0,98:1. Besides the small
group from z = +1,3 - +1,69, M’r Beal’s observation
appears correct.
For the boys, the overall trend goes from 1,03:1 down to 0,99:1. There
is one anomaly that is difficult to account for, though this is probably
influenced by the relatively small numbers involved. From z = -1.69 -
-1,0 (n = 158), the ratio trends steadily down from 1,030:1 to 1,021:1,
but then jumps to 1,032:1. After this, the ratio again steadily drops,
eventually to 1,01:1 through z = +0,89 (n = 912). It then flattens or
slightly rises through z = +1,3 (n = 88), then drops again, ending at
just above 0,99:1 (n = 108). Again, besides a small group, M’r Beal’s
observation that slower runners run relatively slower at the S.S.
state-meet qualifier (or, possibly, faster at the C.I.F. state-meet)
appears to be true.
A last potential variable that I tested for was divisional ratios. I
assumed going in that the smaller schools would have lower ratios, if
only because they have slower runners and, as seen above, slower runners
run relatively slower at M’t SAC. Though in both boys and girls there
is a trend down from d. 1 to d. 5, it is not as smooth or prominent as I
expected, particularly for the boys. The most prominent example of a
difference in ratio is that of the d. 5 girls, whose ratio is 1,002:1
compared to 1,017:1 for d. 1 & d. 2 girls. This sudden drop is not
surprising since the d. 5 girls run 13% - 14% slower than d. 1. It is
surprising that the d. 5 boys, a group that runs 9% - 10% slower than
the d. 1 boys, do not show more of a drop-off.
mu : mu CIF mu SS
d. 1 b.: 1.02050 00:16:6 00:15:47
d. 2 b.: 1.01801 00:16:31 00:16:14
d. 3 b.: 1.02336 00:16:39 00:16:16
d. 4 b.: 1.01518 00:17:14 00:16:59
d. 5 b.: 1.01634 00:17:37 00:17:21
mu : mu CIF mu SS
d. 1 g.: 1.01073 00:19:6 00:18:55
d. 2 g.: 1.01068 00:19:6 00:18:55
d. 3 g.: 1.00821 00:19:45 00:19:36
d. 4 g.: 1.00926 00:20:26 00:20:15
d. 5 g: 1.00219 00:21:35 00:21:33
The only variables that seem to affect the ratio between the SS
state-meet qualifier and the state-meet are sex and a runner’s time at
the state-meet qualifier. It is possible that there is a weak
relationship by division, and no apparent relationship based on class.
It would be interesting to test whether relative experience affects
performance.
Sunday, September 12, 2010
Ed Sias Invitational coverage courtesy of flotrack.org
You can check out tons of interviews with the top performers from today's meet at the following link:
http://www.flotrack.org/videos/coverage/view/237548-2010-ed-sias-cross-country-invitational
Such as the following interview with the fastest girl, Granada HS freshman, Sophie Hartley:
Track and Field Videos on Flotrack
some newspaper coverage:
Vacaville High School boys cross country team finishes second in Martinez event
and from Santa Rosa Press Democrat website:
http://www.northbay.com/running/10xced.html
Saturday, September 11, 2010
NorCal Saturday results...
Earlybird Invitational at Toro Park courtesy of www.lynbrooksports.com
http://www.dyestatcal.com/ATHLETICS/XC/2010/ebird.htm
Ed Sias Invitational courtesy courtesy of dyestatcal.com
http://rise.espn.go.com/track-and-xc/california/2010-xc/Results/September/11-Ed-Sias-Inv.aspx?pursuit=TrackAndXC
Pictures from the Ed Sias Invitational will be posted at the following link:
http://sportsimagewire.com/home.html
Wolverine Invitational courtesy of dyestatcal.com
http://rise.espn.go.com/track-and-xc/california/2010-xc/Results/September/11-Wolverine-Inv.aspx?pursuit=TrackAndXC
Sierra Invitational courtesy of dyestatcal.com
http://rise.espn.go.com/track-and-xc/california/2010-xc/Results/September/11-Sierra-Inv.aspx?pursuit=TrackAndXC
More results will be posted as I find them as well as newspaper articles covering above races and more.
Friday, September 10, 2010
NorCal results and newspaper coverage...
Earlybird Invitational gets cross country off and running
http://www.thecalifornian.com/article/20100909/SPORTS/100909037/Earlybird-Invitational-gets-cross-country-off-and-running
RUNNING: Baler boys solid at TCAL Jamboree
http://www.freelancenews.com/sports/268537-running-baler-boys-solid-at-tcal-jamboree
Beckwith leads Bears to team title in XC meet
http://www.paloaltoonline.com/news/show_story.php?id=18195
Anderson ready for cross country season (Half Moon Bay HS)
http://www.hmbreview.com/articles/2010/09/08/sports/doc4c87c67c1aff2443325409.txt
Boys Cross Country Preview (Las Lomas HS)
http://laslomaspage.com/?p=807
Boys' Cross Country restarts varsity roster (Palo Alto HS)
http://voice.paly.net/node/23470
Carlmont's Peterson, M-A's Beckwith best in PAL meet
http://www.mercurynews.com/peninsula/ci_16040058?nclick_check=1
Stinson Beach Relays

http://www.marinij.com/sports/ci_16027791
Drake makes impressive sweep at the beach
http://sananselmofairfax.patch.com/articles/drake-makes-impressive-sweep-at-the-beach
Will get results posted later.
Thursday, September 09, 2010
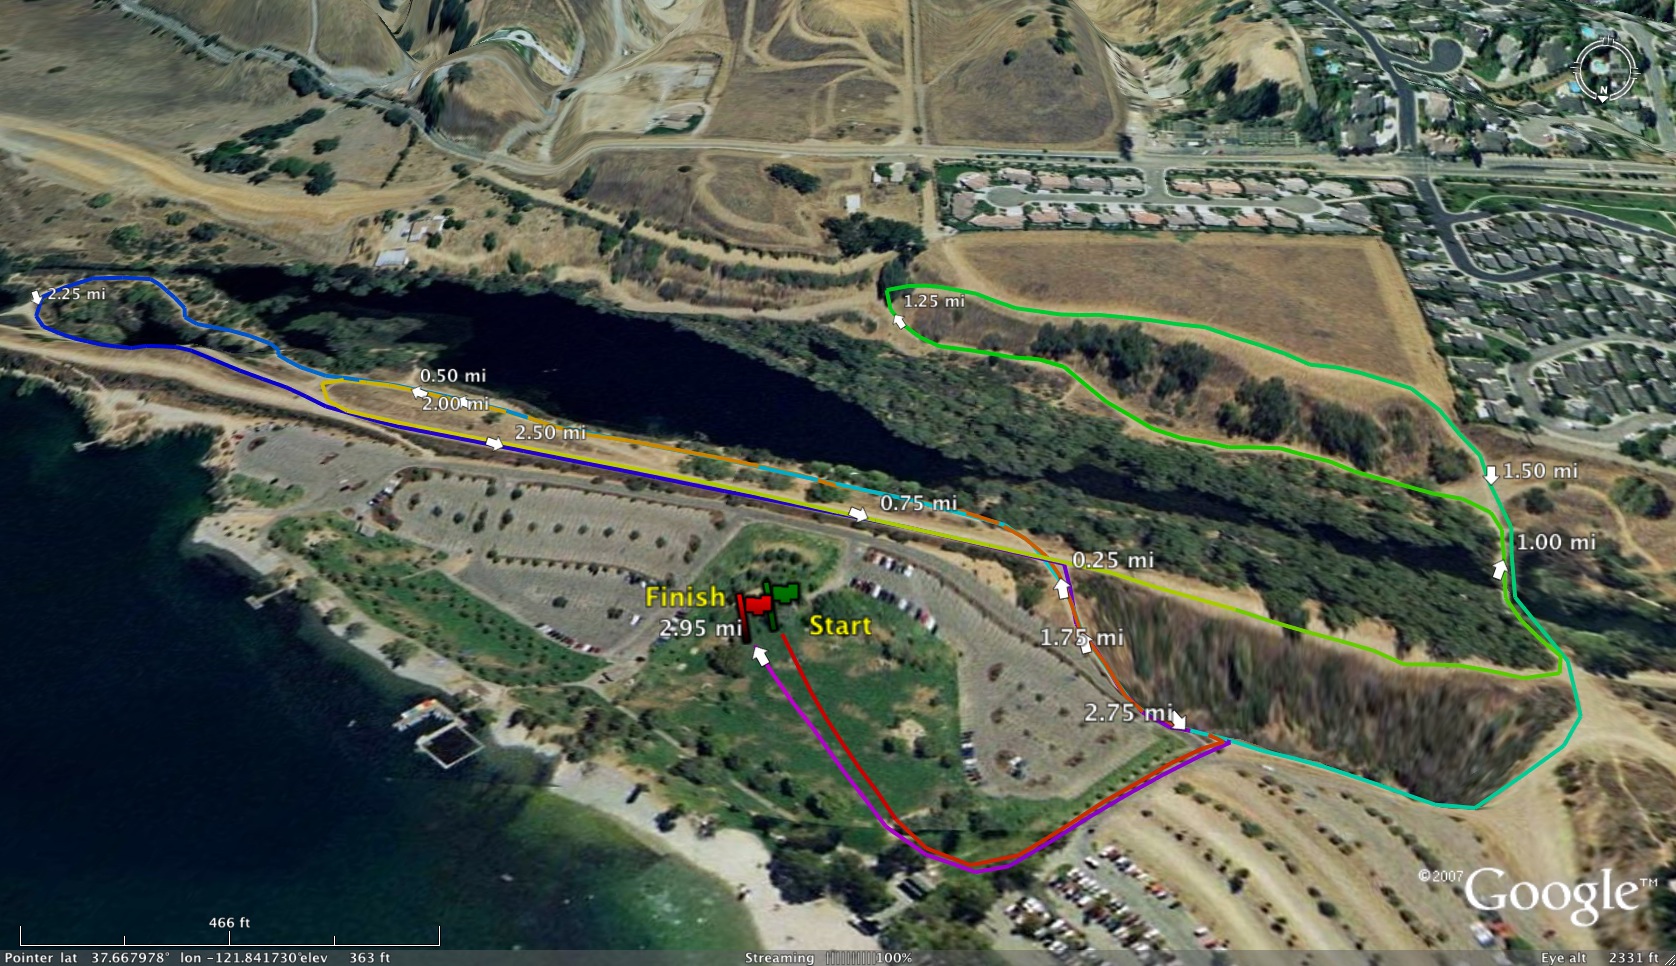
Course Performance Population Distributions
Check out this tool for graphing the frequency distribution of performances at many California cross country courses.
http://www.xcstats.com/course_
The simplest way to think about it is that it gives an SAT score for running. For a given performance, it shows where that time stands in relation to the overall population of high school runners.
Here is the graph for Crystal Springs. As shown, the most common time for boys varsity runners looks to be 17:45 and for non-varsity around 18:50. (These are the highest points on the curves). A time of 19:00 is faster than 61% of all runners and faster than 31% of varsity runners.

The graphs are generated by taking the results of races from 2006 to present, then grouping the performances into bins, for example 16:10 to 16:20, then graphing the number of races who fell into that range. It’s quite simple. For the statistics minded, we used the number of bins based on the square root of the number of races, then eliminated any courses where the bin size was over 20 seconds. The amount of source data ranged from 500 races to over 48,000 at Mt. Sac. The graphs are normalized so that the area under the curve is 1.
Enjoy!
Mike Sherwood
www.xcstats.com
PS – We also have a course time converter which simply uses the average times of runners to determine the conversion factors. Not nearly as fancy or accurate as Sstoz’s work!
Monte Vista Invitational Summary by Mike Davis
Tuesday, Sept 7th
Oak Hill Park, Danville CA (NCS)
2.0 miles. Hilly
Grade level races
Great weather greeted the runners from 22 area schools at the 27th edition of the Monte Vista Invitational on Tuesday afternoon. Over 1000 runners competed in 8 grade/gender level races! While no formal team score were kept, that didn't stop some fast racing up front and some spirited competition among new and veteran runners alike.
Castro Valley had the fastest individual runners today, with Sr Kelsey Santisteban winning the girls race in a new course record time of 12:23.19 over the difficult 2 mile course while fellow CV Senior Ben Eversole run a very quick 10:47.82 to take the boys crown. Individual race winners included:
Frosh Boys: Aidan Goltra, Las Lomas 11:30.00
Frosh Girls: Sophie Hartley, Granada 12:37.06
Soph Boys: Adler Falkner, Acalanes 11:07.98
Soph Girls: Kelli Berge, Acalanes 12:57.66
Junior Boys: Parker Deuel, San Ramon Valley 11:02.78
Junior Girls: Carina Novell, Granada 13:09.20
Senior Boys: Ben Eversole, Castro Valley 10:47.82
Senior Girls: Kelsey Santisteban, Castro Valley 12:23.19 * CR
In the unofficial team results, based on combining all the boys and girls races, Granada was the strongest on the girls side, with Acalanes and Monte Vista next in line. For the boys, Amador and Las Lomas were in a virtual dead heat, with host Monte Vista only a couple points off the pace.
Complete results courtesy of ESPN Rise:
http://rise.espn.go.com/track-and-xc/california/2010-xc/Results/September/07-Monte-Vista-Invitational.aspx
http://rise.espn.go.com/track-and-xc/california/2010-xc/Results/September/07-Monte-Vista-Invitational.aspx
Subscribe to:
Posts (Atom)
Popular Posts
-
 You can now view all the entrants plus their performance mark from the section qualifier for this weekend's CA State Track and Field ...
 -
 Bumping this back up to the top. The list has not been updated in a few years so if you have athletes that you think deserve to...
 -
Central Coast Section Results: http://www.rtspt.com/events/cif/2017Meets/ccsxc17/ Sac-Joaquin Section Section Finals: http://timerhub....
-
Below is the schedule for the 2013 Cross Country season. If you see any errors, additions or can confirm any dates, please email me at alb...
-
Just added: Info for Ghebray Invitational on September 22nd. With one extra Saturday in September next year, I started to hunt down the d...
-
Bold meets are confirmed for 2014 season. Non bolded dates are from 2013 season. August 2014 8/22 Ryan Bousquet Memorial Run at Yorba Reg...
-
If you are an athlete and you have a question about race strategy, training or anything else that is pertinent to Track & Field and/o...
-
I will start with one: “Somewhere in the world someone is training when you are not. When you race him, he will win.” — Tom Fleming What...
-
 I will continue to update this list throughout the year. Please feel free to add others in the comment section below. I know I do not hav...
 -
I will once again be writing up the preview article for the NCS Meet of Champions this year. Below are the stripped down version of the ...


